Keeping the Blog Updated and Proportional UK Elections
Having it been just over eight months since I have penned a blog post to this area of my website, I figured it was about time that something new was added. After all, a lot has changed since my last blog post. Time has become a commodity in my second year of university; being over-encumbered with pieces of coursework, lecture notes and revision for exams, as well as other extra-curricular activites leaves little time for other items.
Anyways, with the consequence of facing revision, I did the best thing I could - do something completely different. Somewhere in this mix was a splash of politics (never a good idea), leading me down to the road to creating a small Python program. The program in question takes general election results and converts the result into that of an election run under the additional member system (AMS). In this blog post, I will attempt to maintain a non-partisan view of the electoral systems in the UK and reason the benefits and downsides of each mentioned for the sake of balance.
As of writing, general elections in the UK use FPTP to elect Members of Parliament to constituencies. In practice, there are 650 mini-elections that take place, all deciding the fate of political parties on a national scale. FPTP takes the candidate with the most votes and declares them the winner of the election. One obvious benefit is that the concepts of FPTP are extremely easy to understand; the candidate with the most votes wins. However, there are a host of downsides to FPTP. FPTP encourages the practice of tactical voting, where voters are discouraged from voting for candidates that they may actually want to vote for and are encouraged to vote for candidates that they feel will most likely defeat the candidate they do not like. Furthermore, if an ideologically similar candidate to the favourite stands in the constituency, it can have the side-effect of diluting the amount of votes that each candidate would get - this in turn leads to an opposing candidate, with no rival, to claim victory; this is known as the spoiler effect.
Proportionality and the Gallagher Index#
One major gripe with FPTP is that it is not a proportional system; that is, the amount of votes cast for a political party indicates the percentage of the seats that the party wins. As there is no mechanism for this to occur in FPTP, it becomes apparent that it can lead to disproportionate results.
Take for example the 2015 UK General Election; under the leadership of David Cameron, the Conservative Party won 36.8% of the votes cast across the UK. However, they won 330 of the 650 seats available (50.8%), leading to an outright majority.
Furthermore, the UK Independence Party, under the leadership of Nigel Farage, managed to achieve 12.6% of the nation-wide vote. They gained a single seat (0.2% of the available seats).
After this election, the disparity between votes cast and the number of seats attained lead to calls for electoral reform for general elections. Specifically, people referenced something known as the ‘Gallagher index’ to illustrate the disproportionality of the elections.
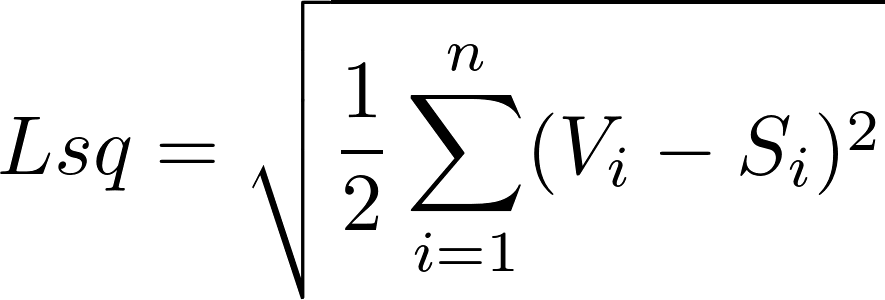 Shown above is the formula for the Gallagher index. In plain English, the formulas sums together the square of the difference between the percentage of the votes cast for a party and the percentage of the seats that the party won. It then halves the sum and then square roots it, giving the Gallagher index. According to the Canadian Special Committee on Electoral Reform, a government should ‘seek to design a system that achieves a Gallagher score of 5 or less.’ The 2015 UK General Election achieved a Gallagher index of 15.04, illustrating a high disproportionality.
Additional Member System (AMS)#
AMS is an alternative electoral system to FPTP that is used in the Scottish parliamentary elections, the Welsh assembly elections and London’s assembly elections. It is also used under the name of mixed-member proportional in Germany and New Zealand’s nation-wide elections.
How AMS Works#
Instead of having one vote, you are given an extra vote; the party vote. With your first vote, you vote for the representative for the constituency. This is typically done through FPTP, as beforehand. With your second vote, the party vote, you vote for your favourite political party. This technically means that political parties become part of the electoral system for the first time - you don’t necessarily need parties in FPTP, but it helps to have a ‘label’ to identify your policies under.
Under AMS, the local representatives all take their seat, in accordance with a normal FPTP election. The party vote is then used to correct the number of MPs elected, by giving parties additional ‘list’ representatives to make the number of MPs more representative of the vote that they achieved.
D’Hondt Formula#
The number of representatives given to each political party from the party vote are allocated through something known as the D’Hondt formula.

V stands for the number of votes cast for the party, and s stands for the number of seats. That is, the quotient is the number of votes cast for the party divided by the number of seats they currently have plus one.
This may seem like an arbitrary value that has been pulled out of a hat, but it makes sense once the full system has been explained.
The D’Hondt system uses a round-based system, allocating representatives until all the seats have been taken up. In each round, the party with the highest quotient is allocated the representative. However, with AMS there is a slight nuance; the number of MPs elected in the constituencies is included in the value s.
What does this mean? Well, it means that if a very popular party has gained close to the number of seats they should have according to the party vote, it is unlikely that they will be given another MP through the D’Hondt formula. This allows other parties to gain MPs that they did not get through constituencies.
To see a real-life example of how this works, look at the results for the 2016 Scottish parliamentary election .
Simulating AMS General Elections in Python#
With AMS finally explained, we can finally dive into how I simulated AMS on UK general elections.
I firstly assumed that the House of Commons would keep the 650 Members of Parliament that it currently houses. However, in order to accommodate the MPs that would be elected via the party vote, the number of constituencies had to be reduced from 650 down to 400. This allows for 250 list MPs to be allocated.
I decided upon this value to strike a balance between preserving the local representation that the UK currently has and having the House of Commons as proportional to the party vote as possible.
Furthermore, to keep some sense of local representation in the party vote MPs, I decided that the party vote MPs should be assigned at a regional level rather than a national level. The following tables show how the party MPs are split up between the nine official regions of England, Scotland, Wales and Northern Ireland.
| Region | Constituencies | Party MPs |
|---|---|---|
| East of England | 35 | 23 |
| East Midlands | 28 | 18 |
| London | 41 | 32 |
| North East England | 19 | 10 |
| North West England | 47 | 28 |
| Northern Ireland | 11 | 7 |
| Scotland | 37 | 22 |
| South East England | 50 | 34 |
| South West England | 34 | 21 |
| Wales | 28 | 12 |
| West Midlands | 37 | 22 |
| Yorkshire and the Humber | 33 | 21 |
| UK | 400 | 250 |
We can finally put it into practice. Firstly, the constituencies gained by a particular party are weighted in terms of the new number of constituencies available. The first count of new constituencies is calculated by taking the number of constituencies they won, dividing by the number of MPs for the region and then multiplying by the new number of constituency MPs.
This approximation leaves some constituency MPs unassigned, so the remaining constituencies are assigned through the D’Hondt method, but ignoring parties that did not get a constituency originally.
With constituencies assigned, we can now perform the D’Hondt method to assign party MPs to each party, based upon the number of constituencies that they have already won. The party vote from constituencies in the actual general election is assumed to be the party vote under the new system.
This then produces the AMS result for each region. As an example, here is the result for Wales in the 2017 UK general election after being converted to AMS.
| Party | FPTP | AMS Constituency MPs | AMS Party MPs |
|---|---|---|---|
| Labour | 28 | 19 | 2 |
| Conservative | 8 | 7 | 7 |
| Plaid Cymru | 4 | 2 | 2 |
| Liberal Democrat | 0 | 0 | 1 |
Python Code#
Each region holds a number of parties, represented through an object from party.py.
class Party:
	conMP = 0
	listMP = 0

	def __init__(self, name, vote, conOld):
		self.name = name
		self.vote = vote
		self.conOld = conOld

	def getName(self):
		return self.name

	def getVote(self):
		return self.vote

	def getConOld(self):
		return self.conOld

	def getConstituencyMP(self):
		return self.conMP

	def getListMP(self):
		return self.listMP

	def setConstituencyMP(self, conMP):
		self.conMP = conMP

	def addListMP(self):
		self.listMP += 1
A region is represented through an object from region.py. A region is also able to calculate its own AMS election internally
from party import Party
import csv
import math
import copy

class Region:

	def __init__(self, name, file, conMPs, listMPs):
		self.name = name
		self.file = file
		self.conMPs = conMPs
		self.listMPs = listMPs
		self.parties = []
		self.readFile()

	def getName(self):
		return self.name

	def addParty(self, party):
		self.parties.append(party)

	def readFile(self):
		with open(self.file) as csvfile:
			reader = csv.reader(csvfile, delimiter=',')
			lineCount = 0
			for row in reader:
				self.addParty(Party(row[0], int(row[1]), int(row[2])))

	def convertToAMS(self):
		allVotes = 0
		leftOverMPs = self.conMPs
		newConMPs = []

		for x in range(0, len(self.parties)):
			allVotes += self.parties[x].getVote()
			newConMPs.append(math.floor(self.parties[x].getConOld() / float(self.conMPs + self.listMPs) * self.conMPs))
			leftOverMPs -= newConMPs[x]

		votes = list(map(lambda x: x.getVote(), self.parties))
		if(leftOverMPs > 0):
			newConMPs = self.dHondtConMethod(leftOverMPs, newConMPs, votes)

		newListMPs = self.dHondtListMethod(self.listMPs, copy.copy(newConMPs), votes)
		newMPs = [sum(x) for x in zip(newConMPs, newListMPs)]
		return list(zip(map(lambda x: x.getName(), self.parties), newConMPs, newListMPs))

	def dHondtConMethod(self, seatsLeft, seats, votes):
		while (seatsLeft > 0):
			maxValue = -1
			seatToAdd = 0
			for x in range(0, len (seats)):
				if(seats[x] > 0 and (votes[x] / (seats[x] + 1)) > (votes[seatToAdd] / (seats[seatToAdd] + 1))):
					seatToAdd = x
			seats[seatToAdd] += 1
			seatsLeft -= 1
		return seats

	def dHondtListMethod(self, seatsLeft, seats, votes):
		newListMPs = [0] * len(votes)
		# Whilst there are seats to assign, check values
		while (seatsLeft > 0):
			maxValue = -1
			seatToAdd = 0
			# For each set for values, compare the D'Hondt value to the current maximum
			for x in range(0, len (seats)):
				if(votes[x] / (seats[x] + 1)) > (votes[seatToAdd] / (seats[seatToAdd] + 1)):
					seatToAdd = x
			newListMPs[seatToAdd] += 1
			seats[seatToAdd] += 1
			seatsLeft -= 1
		return newListMPs
All of the results from across the UK are then combined together in main.py, where the total seats are displayed for each party.
from party import Party
from region import Region

def main():
	east_england = Region("East of England", "data/east_england.csv", 35, 23)
	east_midlands = Region("East Midlands", "data/east_midlands.csv", 28, 18)
	london = Region("London", "data/london.csv", 41, 32)
	north_east_england = Region("North East England", "data/north_east_england.csv", 19, 10)
	north_west_england = Region("North West England", "data/north_west_england.csv", 47, 28)
	northern_ireland = Region("Northern Ireland", "data/northern_ireland.csv", 11, 7)
	scotland = Region("Scotland", "data/scotland.csv", 37, 22)
	south_east_england = Region("South East England", "data/south_east_england.csv", 50, 34)
	south_west_england = Region("South West England", "data/south_west_england.csv", 34, 21)
	wales = Region("Wales", "data/wales.csv", 28, 12)
	west_midlands = Region("West Midlands", "data/west_midlands.csv", 37, 22)
	yorkshire_humber = Region("Yorkshire and the Humber", "data/yorkshire_humber.csv", 33, 21)

	regions = []
	regions.append(east_england)
	regions.append(east_midlands)
	regions.append(london)
	regions.append(north_east_england)
	regions.append(north_west_england)
	regions.append(northern_ireland)
	regions.append(scotland)
	regions.append(south_east_england)
	regions.append(south_west_england)
	regions.append(wales)
	regions.append(west_midlands)
	regions.append(yorkshire_humber)

	computedRegions = []
	for x in regions:
		computed = x.convertToAMS()
		computedRegions.append(computed)
		print(x.getName())
		for y in computed:
			print(y[0] + "\t" + "Constituency MPs: " + str(y[1]) + "   List MPs: " + str(y[2]))
		print()
	computeUKWide(computedRegions)

def computeUKWide(computedValues):
	isEmptyList = False
	print("United Kingdom")
	while(not isEmptyList):
		conMP = 0
		listMP = 0
		party = computedValues[0][0][0]
		for x in computedValues:
			values = list(filter(lambda y: y[0] == party, x))
			if(len(values) > 0):
				conMP += values[0][1]
				listMP += values[0][2]
		print(party + "\t" + "Constituency MPs: " + str(conMP) + "   List MPs: " + str(listMP))

		newComputedValues = []
		for x in computedValues:
			values = list(filter(lambda y: y[0] != party, x))
			if(len(values) > 0):
				newComputedValues.append(values)
		if len(newComputedValues) > 0:
			computedValues = newComputedValues
		else:
			isEmptyList = True

if __name__ == "__main__":
	main()
Using this, the House of Commons would look like this under AMS for the 2017 general election:
| Party | MPs | % of votes | % of seats |
|---|---|---|---|
| Conservative | 280 | 42.4% | 43.1% |
| Labour | 270 | 40.0% | 41.5% |
| Liberal Democrat | 43 | 7.4% | 6.6% |
| SNP | 22 | 3% | 3.4% |
| UKIP | 7 | 1.8% | 1.1% |
| DUP | 7 | 0.9% | 1.1% |
| Green | 6 | 1.6% | 1.0% |
| Sinn Fein | 6 | 0.7% | 1.0% |
| Plaid Cymru | 4 | 0.5% | 0.6% |
| SDLP | 2 | 0.3% | 0.3% |
| UUP | 2 | 0.3% | 0.3% |
| Alliance | 1 | 0.2% | 0.2% |
Using these results, we can calculate the Gallagher index for disproportionality under the AMS election.
| Party | % of votes | % of seats | Difference | Sq. Dif |
|---|---|---|---|---|
| Conservative | 42.4% | 43.1% | 0.7% | 0.49 |
| Labour | 40.0% | 41.5% | 1.5% | 2.25 |
| Liberal Democrat | 7.4% | 6.6% | 0.8% | 0.64 |
| SNP | 3% | 3.4% | 0.4% | 0.16 |
| UKIP | 1.8% | 1.1% | 0.7% | 0.49 |
| DUP | 0.9% | 1.1% | 0.2% | 0.04 |
| Green | 1.6% | 1.0% | 0.6% | 0.36 |
| Sinn Fein | 0.7% | 1.0% | 0.3% | 0.09 |
| Plaid Cymru | 0.5% | 0.6% | 0.1% | 0.01 |
| SDLP | 0.3% | 0.3% | 0% | 0 |
| UUP | 0.3% | 0.3% | 0% | 0 |
| Alliance | 0.2% | 0.2% | 0% | 0 |
Summing the square differences gives us 4.53. Therefore, halving it and then square rooting it, to give the Gallagher index, gives us an index of 1.505. In other words, AMS gives very proportionally representative elections.
Hallelujah, we finally got the result.
Downsides of AMS#
Now that I’ve shown that AMS produces proportional results, I need to keep my promise that I will be non-partisan and discuss the downsides of AMS.
Firstly, and quite obviously, it is a lot more complex than FPTP. As I’ve had the spend the majority of this blog post detailing the inner workings of how it works to get to this point, as compared to a sentence with FPTP, you can see why some people would argue in favour of FPTP’s simplicity.
Secondly, AMS doesn’t produce the same level of local representation as FPTP does. In mid-2016, the population of the UK was approximately 65.6 million. This means that under FPTP, every MP should represent approximately 100,900 people. However, under AMS, each constituency MP would represent approximately 164,000 people.
Furthermore, introducing party vote MPs can create two different ‘classes’ of MP - one that answers to constituents and faces the risk of losing their seat at the next election, and one that has a significantly lower risk of losing their list seat at the next election.
Conclusions#
To summarise as briefly as possible, FPTP offers simplicity, but trades off proportionality and can lead to minority rule, with other unintended side-effects such as the spoiler effect and tactical voting.
On the contrary, AMS is more complex, but produces much more proportional results. The nation-wide results closer reflect how the people voted, producing a more reflective House of Commons.